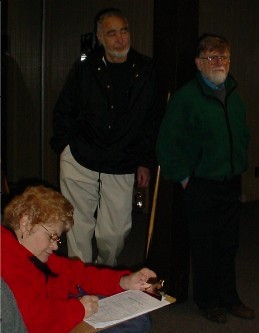
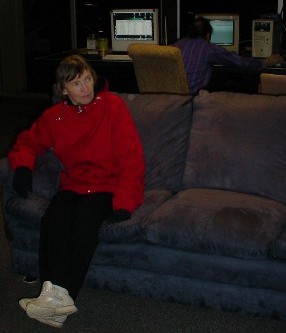
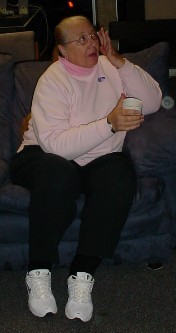
Two things separated this party from
most of the election night partys around us. One was that we would have
the Green Party results announced as soon as it was known. The other
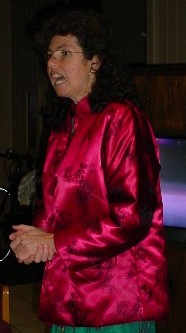
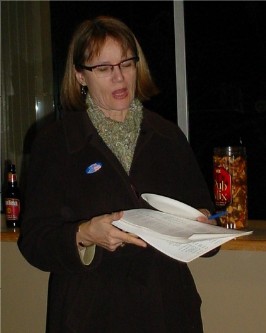
was that Carol would make a pitch explaining why we should help her get
on the ballot as a Green Party Candidate for Congress in California's
14th District.
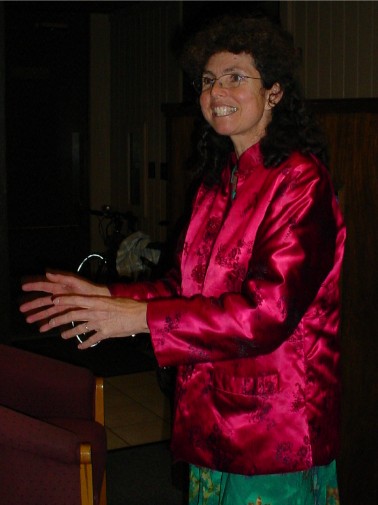
Carol ended up
getting several people to volunteer to gather signatures for her
campaign. Also, something like twenty people signed her papers there.
Not so long after
Carol finished her speech I announced the results that we downloaded
from the Registrar of Voters website. They looked a lot like these more
recent numbers:
|
Kent Mesplay (Grn) |
37 |
3.2 % |
  |
570 |
2.0 % |
  |
| |
Jared Ball (Grn) |
29 |
2.5 % |
  |
453 |
1.6 % |
  |
| |
Jesse Johnson (Grn) |
24 |
2.0 % |
  |
517 |
1.8 % |
  |
| |
Kat Swift (Grn) |
53 |
4.7 % |
  |
863 |
3.1 % |
  |
| |
Ralph Nader (Grn) |
651 |
57.0 % |
  |
17,198 |
61.2 % |
  |
| |
Elaine Brown (Grn) |
58 |
5.1 % |
  |
1,285 |
4.6 % |
  |
| |
Cynthia McKinney (Grn) |
291 |
25.5 % |
  |
7,224 |
25.7 % |
  |
| |
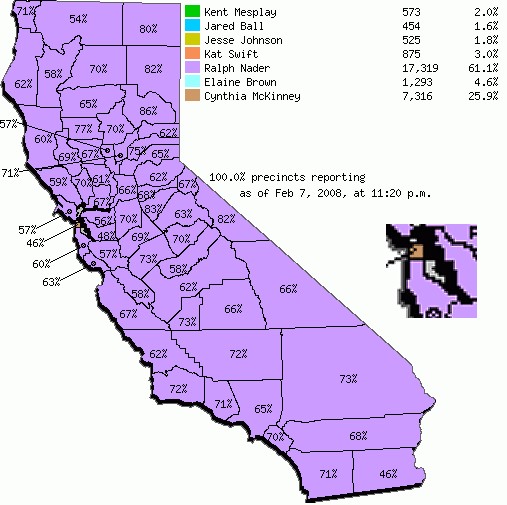
Looking at the
results, I was surprised by how close to the Statewide average we fell.
Maybe we like the little guy a little more than most, but our
tendencies are the same. The only County Cynthia took was San
Francisco. The pattern reminded me of 1994, when the only County that
voted for the Statewide gas tax was San Francisco. Seems like the
voters there are simply ahead of the rest of us...
A week later the
numbers had changed a little bit:
| Candidate |
SCC Votes |
% |
CA Votes |
% |
| Kent Mesplay |
49 |
3.1% |
634 |
2.0% |
| Jared Ball |
34 |
2.2% |
485 |
1.5% |
| Jesse Johnson |
31 |
2.0% |
550 |
1.7% |
| Kat Swift |
72 |
4.7% |
958 |
3.0% |
| Ralph Nader |
857 |
56.0% |
18,898 |
60.7% |
| Elaine Brown |
75 |
4.9% |
1,411 |
4.6% |
| Cynthia McKinney |
414 |
27.1% |
8,248 |
26.5% |
